Researchers: Dr. Brenda Casper, Dr. Brent Helliker, Dr. Pierre Liancourt, Dr. Alain Plante
During the summer of 2008, we installed a pilot scale experiment in Dalbay Valley to test the performance of open-top warming chambers in terms of (1) above-ground air temperature, (2) below-ground soil temperature at 10 cm depth, (3) volumetric soil water content at 10 cm depth, and (4) soil CO2 efflux. Review of the literature shows no evidence that previous studies used control chambers to control for reduction in convective heat loss due to the sides of the OTCs. Therefore, we installed two replicates of three treatments: no chamber controls, non-warming control chambers, and warming chambers. The non-warming control chambers were designed to control for differences due to convection by using chambers made with material that does not trap infrared radiation.
Above-ground air temperature in each replicate was monitored continuously from 6/24/2008 to 8/21/2008 in 10 minute intervals using HOBO data loggers. Overall, the results show that both the non-warming control chambers and the warming chambers increased mean daily temperatures by approximately 2°C, with no difference between the non-warming and warming chambers (Fig. 1). Results suggest that reduced convective losses from both chamber designs were significant, and that warming was much greater during the daytime and minimal during the night.
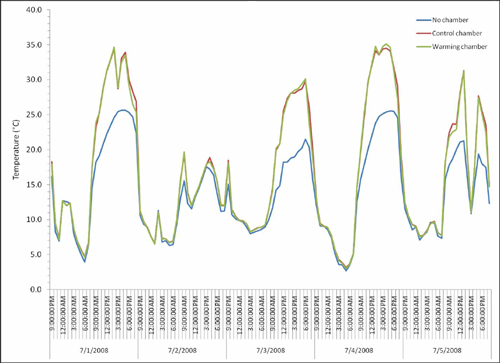 |
| Figure 1. Above-ground temperatures (°C) during a typical 5-day period. Blue line=no chamber, red=control chamber, green=warming chamber (n=2 for each treatment). |
Below-ground soil temperatures were monitored continuously from 6/25/2008 to 8/21/2008 in 10 minute intervals using HOBO data loggers buried at 10 cm below the ground surface. Results were similar to above-ground temperatures, where both chamber designs warmed the soil by approximately 1°C over the monitored period (Fig. 2). However, unlike the above-ground results, soil temperature in the warming and non-warming control chambers remained elevated overnight.
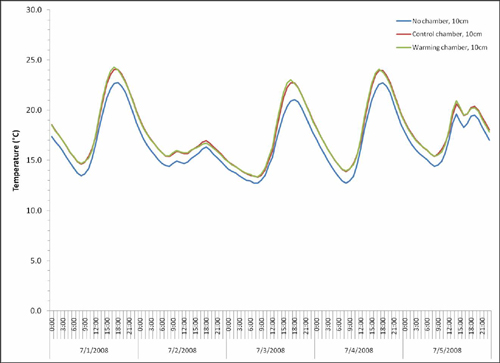 |
| Figure 2. Below-ground temperatures (°C) during a typical 5-day period. Blue line=no chamber, red=control chamber, green=warming chamber (n=2 for each treatment). |
Volumetric soil water content was monitored daily from 6/26/2008 to 8/21/2008 using a frequency domain reflectance soil moisture probe (PR2-4 from Dynamax, Inc.). Moisture measurements showed the non-warming and warming chamber plots were significantly drier (less water content) than the control plots until a precipitation event on 7/27/2008. Water content for all plots was similar between treatments thereafter (Fig. 3).
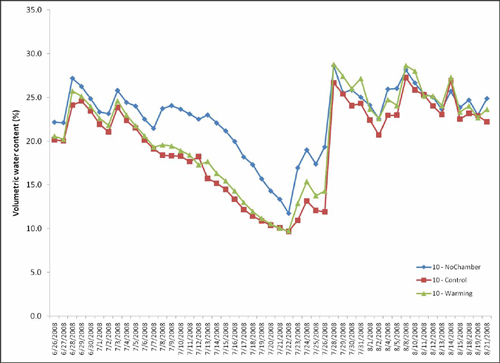 |
| Figure 3. Daily volumetric soil water content (%) at 10 cm depth. Blue line=no chamber, red=control chamber, green=warming chamber (n=2 for each treatment). |
Soil carbon dioxide (CO2) efflux (a.k.a. soil respiration) was monitored daily from 6/27/2008 to 7/9/2008 using an EGM-4 infra-red gas analyzer equipped with an SRC-1 soil respiration chamber from PP Systems Inc. Respiration rates were highly variable, but the control plots without chambers showed generally lower rates of respiration (Fig. 4). Averaged over the monitoring period, respiration rates were 0.553 ± 0.118 g CO2 m-2 h-1 in the no-chamber control plots, 0.638 ± 0.140 g CO2 m-2 h-1 in the non-warming control chamber plots, and 0.618 ± 0.122 g CO2 m-2 h-1 in the warming chamber plots.
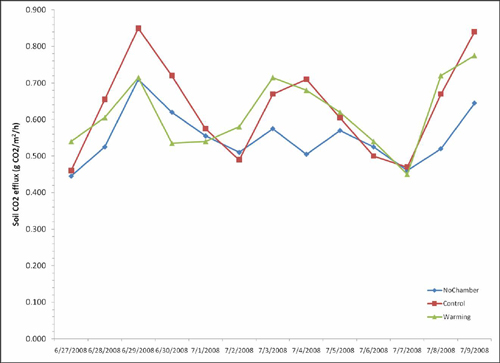 |
| Figure 4. Daily soil CO2 efflux (g CO2 m-2 h-1) Blue line=no chamber, red=control chamber, green=warming chamber (n=2 for each treatment). |
Other PIRE Mongolia Research Projects
- Tree-ring Study: Tree-ring isotope reconstruction of larch (Larix sibirica) physiological response to increased temperatures and CO2 enrichment
- Carbon Stocks: Assessment of belowground carbon stocks in forest and steppe
- Modelling: Steppes and forests as alternative states and integration of field studies
- Monitoring: Monitoring of climate, permafrost and stream hydrology
- Nomadic Herders: Survey of the impacts of nomadic grazing patterns